„top“ is one of those programs, that are used quite often but actually nobody talks about. It just does its job: showing statistics about memory, cache and cpu consumption, listing processes and so on. Actually top provides you some more features like batch mode and the ability to kill processes, but it’s all quite low level – e.g. you have to type the process id (pid) of process you want to kill.
So, though an applications like top makes sense on the console, a more sophisticated one would be great, extending the basic top functionality with enhancements to it’s usage. This tool already exists: It’s the ncurses based „htop“ and we’ll have a closer look at it now.
For the beginning: Install „htop“ by running „aptitude install htop“, Synaptic or the package manager of your choice. As you can see, htop is quite colorful, which is, of course, a matter of taste. In my opinion, colors make sense, when the they mean something or provide better readability. So let’s check the output in brief:
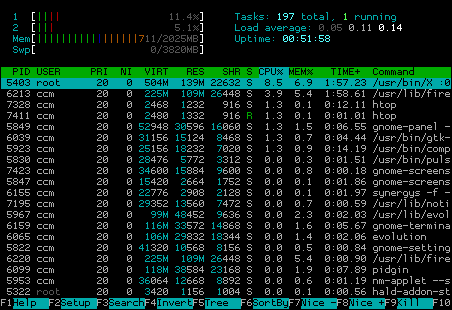
At the upper left corner you see statistics about the usage of cpu cores (in my case there are two of them, marked „1“ and „2“), memory and swap statistics, while on the right side, you have the common uptime/load stats. The interesting part is the usage of colors in cpu/ram/swap bars. If you are new to htop you have to look the colors up at least once. Therefore just stroke „h“ („F1“ should work, too, but Gnome might get in your way) and you’ll see a nice explanation in the help:

Quite interesting is the distribution between green and red in the cpu stats, as a high kernel load often means something goes wrong (with the hardware i/o for instance). In the memory bar the real used ram is marked green – blue and orance actually could be cleared by the kernel if necessary. (People are often confused that their ram seems to be full, when calling a tool like/htop though they are not running that many programs. It’s important to understand, that the memory is also used for buffering/caching and that this memory can often be used by „real“ data later on).
So what’s the next htop feature? Use your mouse, if you like! You can test it by clicking on „Help“ on the menu bar at the bottom. Maybe while clicking around a bit you already noticed that you can also click on processes and mark them. What for? Well, htop enables you to kill processes quit easy, as you don’t have to type a process id, write a pattern or something, you just can mark them with a mouse or cursor and either click on „Kill“ in the menu or stroke the „F9“ or „k“ key. „htop“ will let you choose from a list of signals afterwards:
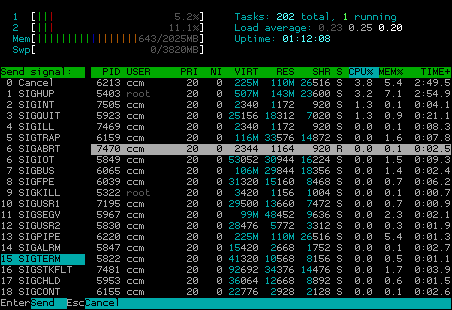
Of course you cannot kill processes that belong to your user when htop does not run as root (i.e. with „sudo“). „htop“ marks processes that belong to user it is run by with a brighter process id:

Sadfully this also means, that running htop as root/sudo, marks processes that belong to non-root with a darker grey. But hey, that’s a nice missing feature for patch, isn’t it?
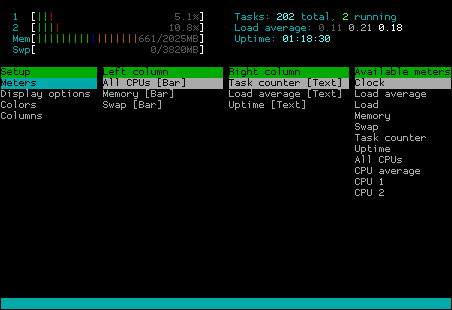
If you like to become an advanced htop user, you can check the „Setup“ menu (click it or press the „F2“ or „S“ key). You will see a menu for configuring the output of htop, enabling you to switch off and on the display of certain information:
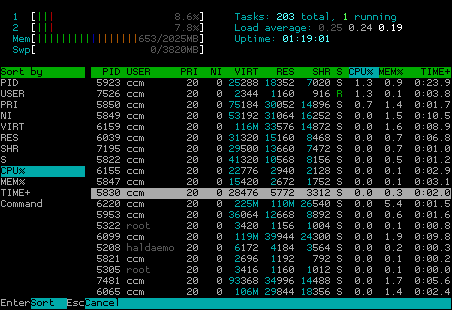
Of course you can also sort the process list (click „Sort“ or press „F6“) which give you a list of possible sort parameters:
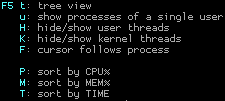
In spite of this, you can switch to a process tree display and sort it by pressing one of the keys showed below:
So let me give you a last nice gimmick and then end for today: You can try to attach „strace“ to a running process by marking the process typing „s“. If you don’t know, what strace is, don’t bother, if you do, you will probably like this feature pretty much.
I hope you got the clue about using htop, which is a really neat, full featured console top replacement that is even worth to be used when running X as it supports mouse usage and brings everything you need while still having a small footprint. If you have alternatives, you like mention, feel free to drop them as a comment.

